Featured Articles

Boost Your Website Traffic with High Quality DA/PA 40+ Backlinks
Apr 7, 2023

In today’s competitive world, one must be knowledgeable about the latest online bus...
Oct 12, 2018
In today's age of digital transformation, if someone asks, "What is data visualization?" many might hurriedly answer – "It's making data look nice."
But there's a profound depth beneath those 'nice-looking charts.'
Data visualization, particularly Business Data Visualization, is a powerful tool for transforming complex and intricate data into understandable and actionable insights.
To illustrate its importance, in 2011, RedShelf, a digital content distribution company, struggled with complex data. CFO Tim Haitian introduced Grow's data visualization dashboard, unifying data sources. This strategic decision not only accelerated decision-making but also reduced queries and provided a panoramic view of their operations. In a matter of months, the power of effective data visualization was evident as RedShelf began leading with data-driven strategies.
Shifting our focus to the past, let's embark on a historical journey to grasp how data visualization has evolved.
A Historical Glimpse into Data Visualization Dashboards
Visual representation of information isn’t a new fad. From primitive cave paintings to the sophisticated data visualization dashboard tools we use today, humans have always sought ways to depict data visually. The evolution from basic charts to interactive digital data dashboards showcases our perpetual need to understand and communicate information effectively.
With this backdrop, let's explore the modern relevance of data visualization.
Beyond Aesthetics: Key Advantages of Data Visualization
Beyond the mere visual appeal, Business Data Visualization holds the key to unveiling valuable insights, fostering innovation, and driving informed decision-making. Here, we dive into the captivating world of data visualization and uncover its profound advantages.
-
Storytelling with Data:
Business Data Visualization transforms complex data into compelling narratives via charts and graphs. This simplifies communication and engages audiences effectively.
For example, Spotify employs a Data Visualization Dashboard to craft narratives about its user base. It has a 'Wrapped' feature, an interactive data visualization, allowing users to discover their top songs, artists, and music genres throughout the year.
Similarly, tools like Grow’s can spotlight often-overlooked yet vital data points, guiding more insightful decisions.
-
Cognitive Benefits and Complexity Simplified:
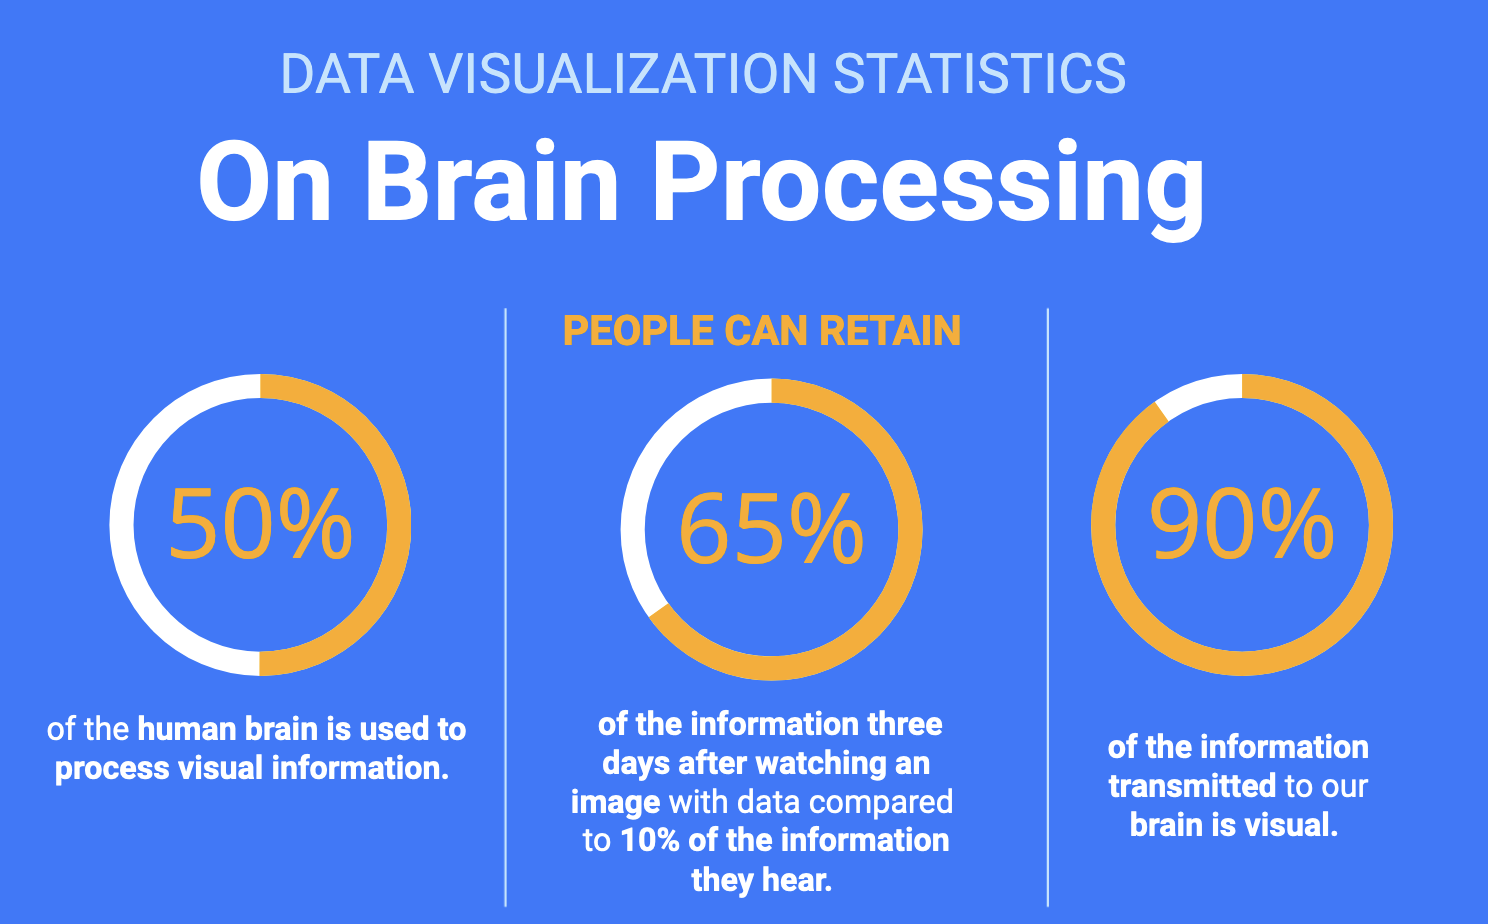
Data visualization capitalizes on our brain’s inherent ability to process visual information faster than text, simplifying the intrinsic complexity in vast datasets. In fact, the human brain interprets visual information 60,000 times more rapidly than text. This simplifies the intrinsic complexity in vast datasets, meaning not only do we comprehend the data faster, but the essence of even the most intricate data sets becomes accessible to those without a technical background.
-
Increased Accessibility:
Understanding intricate data isn't exclusive to data scientists. Cloud-powered Data Visualization Dashboards make complex data accessible to all, regardless of expertise. This ensures that essential insights are readily available to everyone in an organization, regardless of location.
For instance, Edit Suits Co., a luxury menswear brand, expanded to London and Singapore, and they encountered data management challenges. However, Grow Business Data Visualization streamlined operations by consolidating KPIs into a single dashboard, overcoming geographic limitations.
-
Decision-Making Advantage:
Dashboard visualization tools enable companies to expedite their decision-making processes, giving them a competitive advantage. Studies show businesses leveraging data visualization dashboards can make decisions and react to market changes up to five times faster than industry averages.
Many industries, like stock trading, airlines, hotels, and online retailers, depend on real-time data for rapid market adjustments and strategy adaptations driven by variables such as current events, weather, and customer trends. Real-time insights are critical for efficient market monitoring in these dynamic sectors.
-
Enhanced Data Exploration:
The interactive Data Visualization Dashboard makes it easy to explore datasets. Businesses can delve into specific data points and apply filters, empowering business teams to examine data from various perspectives. Notably, companies with advanced analytics capabilities reap considerable benefits in their operations and decision-making. They are:
-
2x more likely to be in the top quartile of financial performance in their sectors.
-
2x more likely to harness data frequently during their decision-making processes.
-
3x more likely to implement decisions as planned.
-
5x more likely to make prompt decisions, much faster than their market counterparts.
Consider 2 Brothers, a moving and delivery service-oriented company, faced with numerous data metrics. However, with Grow's customizable dashboards, they effectively tackled this problem. They've now prioritized key performance indicators (KPIs) for a more focused and effective data exploration.
Grow’s interactive dashboards allow users to drill, filter down, and manipulate views as per their requirements.
-
Emotional Impact and Contextual Embedding:
An effective visualization is more than just a representation – it embeds context and can evoke emotions. For instance, a chart depicting a rise in sales during the holiday season might bring about feelings of accomplishment and motivation, making the data more relatable and the insights more memorable.
Conclusion
In the data-saturated landscape we navigate, a Data Visualization Dashboard serves as our compass, directing us toward unseen insights and innovations. Implementing business intelligence that harnesses data visualization capabilities can yield a remarkable return on investment, delivering $13.01 for every dollar spent, as reported by Nucleus Research
But the challenge lies in cherry-picking the right visual elements to resonate with the dataset and audience. With the right resources and tools, this task becomes less daunting.
Want to harness the full potential of data visualization for your business? Explore Grow’s suite of cutting-edge Dashboard Visualization tools with user-friendly interfaces, robust analytics, and seamless integration. Quickly transform your data into actionable insights, streamline decision-making, and gain a competitive edge.
Get in touch at Grow.com to kickstart your 14-day free Grow demo!
Dive into Grow Features & Capabilities GetApp for an appropriate picture of its efficiency and consumer feedback.
Article source: https://article-realm.com/article/Business/52061-Why-Data-Visualization-is-More-Than-Just-Pretty-Charts.html
Comments
Reviews
Most Recent Articles
- Jul 22, 2026 US Durable Medical Equipment Market: Size, Trends, and Growth Opportunities by coherentmarketinsights
- Jul 22, 2026 Reinforcement Corrosion Protection: The Key to Durable and Sustainable Concrete Structures by Ivar Eriksson
- Jul 22, 2026 Organic Feed Market Growth and Strategic Outlook 2026–2033 by Coherent MI
- Jul 22, 2026 Plastic Crates Market Growth, Insights, and Segment Analysis 2026-2033 by Coherent MI
- Jul 22, 2026 Global Sacroiliac Joint Fusion Market Growth, Trends, and Segmentation Analysis by Coherent MI
Most Viewed Articles
- 10393 hits Market Overview: Membrane Contactor Industry 2025 by Terra Logistics
- 8467 hits Mist Sprayer Pumps Market Demands, Trends, Industry Analysis, Segmentation by 2032 by ellamrfr
- 6273 hits Next-Gen Connectivity and the Rising Demand for RF Semiconductors by James Cameroon
- 5580 hits Digital Printing Packaging Market by Technology, Application, and Region by James Cameroon
- 4611 hits Flexographic Printing Plates Market Size, Share, Report 2024-32 by ellyse perry
Popular Articles
In today’s competitive world, one must be knowledgeable about the latest online business that works effectively through seo services....
80948 Views

Walmart is being sued by a customer alleging racial discrimination. The customer who has filed a lawsuit against the retailer claims that it...
48471 Views
Are you caught in between seo companies introduced by a friend, researched by you, or advertised by a particular site? If that is...
37016 Views

Facebook, the best and most used social app in the world, has all the social features you need. However, one feature is missing. You cannot chat...
23334 Views
If you have an idea for a new product, you can start by performing a patent search. This will help you decide whether your idea could become the...
14547 Views

Moving becomes easy when you have the right moving accessories. These moving accessories help secure and protect your item by ensuring that no harm...
12430 Views

A lot of us look forward to the result of moving and not the process itself. It is pretty typical behavior, though. As modern people, many things...
11504 Views

Building a custom home is an exciting adventure. It’s your chance to bring your vision to life and create an area that sincerely displays...
11305 Views

Moving from one state, city, or even to a whole different county, is something that is either dictated by choice or circumstance. This is because,...
11258 Views

A membrane contactor is a device that enables the transfer of components between two immiscible phases, typically a gas and a liquid, through a...
10393 Views
Statistics
| Members | |
|---|---|
| Members: | 16736 |
| Publishing | |
|---|---|
| Articles: | 78,411 |
| Categories: | 202 |
| Online | |
|---|---|
| Active Users: | 6781 |
| Members: | 11 |
| Guests: | 6770 |
| Bots: | 11372 |
| Visits last 24h (live): | 17895 |
| Visits last 24h (bots): | 40220 |


