Featured Articles

Boost Your Website Traffic with High Quality DA/PA 40+ Backlinks
Apr 7, 2023

In today’s competitive world, one must be knowledgeable about the latest online bus...
Oct 12, 2018
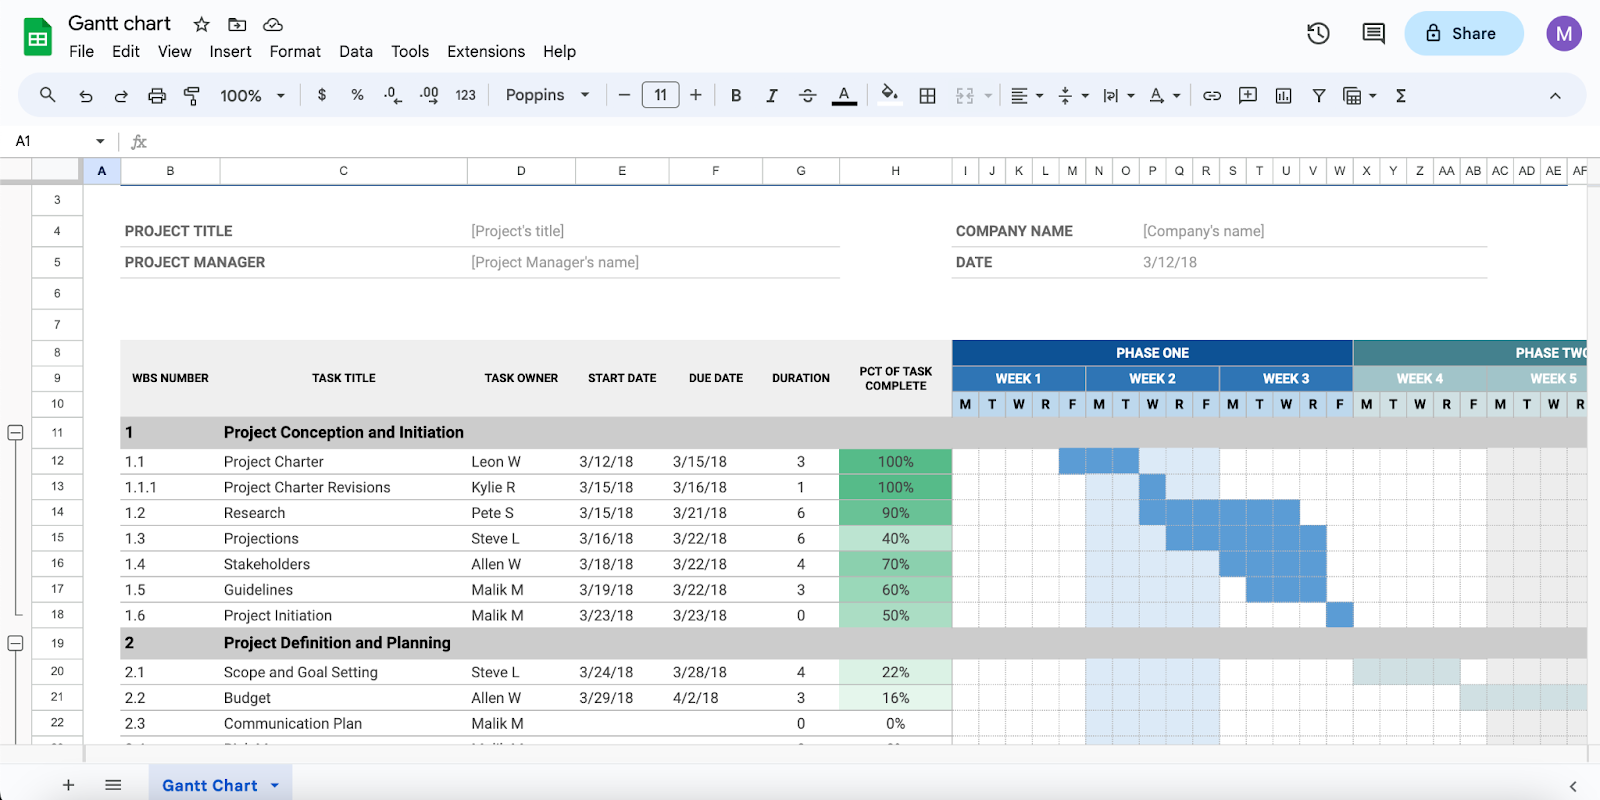
In an era where data has become the new gold, the tools we use to interpret and represent it have gained significant importance. From primitive charts on a piece of paper to sophisticated interactive dashboards, data representation has evolved drastically. This brings us to the ongoing debate on Excel spreadsheets versus contemporary data visualization tools. Which offers better business data visualization? Let's dive in.
What are Excel Spreadsheets?
Microsoft Excel, since its inception, has been the go-to tool for businesses across the globe. Beyond basic data storage, it offers formula-driven calculations that revolutionized how businesses approached data. Its advanced features, including pivot tables, charts, and integration capabilities with other Microsoft products, have made it a versatile tool for many. While Excel has its merits, how does it fare against the wave of modern data visualization platforms?
The World of Data Visualization Tools
When we broach the topic of ‘what is data visualization’ in today's context, we refer to the representation of information in a visual format like charts, graphs, and maps to understand trends, outliers, and patterns. While Excel offers these capabilities, platforms like Tableau, Power BI, and Grow further enhance the business data visualization experience with interactive dashboards, real-time analytics, and predictive modeling. These features make business intelligence data visualization a powerful ally in decision-making.
Comparative Analysis
A. Data Input and Storage
While Excel can automate data imports and integrate with various platforms, it often requires a hands-on approach to data management, especially with larger datasets. Modern visualization tools, however, provide more seamless integration with multiple data sources, from cloud storage to real-time feeds, which is a boon for business intelligence data visualization.
B. Complexity of Analysis
In Excel, dissecting complex data demands intricate knowledge of functions and formulas. But the world of no-code data visualization is changing this narrative. Platforms like Grow or Tableau offer drag-and-drop functionalities, bringing complex insights to your fingertips without needing extensive coding knowledge.
C. Interactivity and Presentation
Excel's charts and graphs are primarily static, though with tools and macros, some interactivity can be achieved. However, contemporary Business Intelligence data visualization tools elevate the user experience by offering dynamic, interactive dashboards. The difference in business data visualization quality is evident when comparing a static Excel chart to a real-time, interactive dashboard.
D. Collaboration and Sharing
While Excel now offers cloud-based collaboration, traditionally, its collaboration often meant juggling multiple file versions, risking data integrity. Modern visualization platforms, such as Grow, champion collaboration by permitting multiple users to work on shared dashboards, ensuring data remains uncompromised.
E. Scalability
Excel remains a reliable choice for managing medium-sized, structured data, where the information neatly fits into defined categories such as numeric, date-based, or character-based. It's particularly suited for SMEs or organizations that handle moderate volumes of such structured data.
Grow, in contrast, shines when dealing with large volumes of unstructured data. Unstructured data, which doesn't fit neatly into standard rows and columns, presents challenges that demand dynamic and intricate processing. For example, parsing varied website reviews, each with its unique tone and style, can be complex. Grow is tailored to extract insights from such big data challenges, making it a powerful asset for organizations of all sizes. The cloud-based nature of tools like Grow ensures they handle substantial data loads efficiently, promising a more resilient and effective business intelligence data visualization.
Case Studies: Real-world Scenarios
A. Sales Forecasting:
Imagine a sales manager trying to predict the next quarter's numbers. While Excel might provide some rudimentary forecasts, visualization tools use AI-driven insights to offer more accurate projections. Using Grow's BI dashboard tools, Altaworx has effectively fine-tuned its revenue stream, identifying key opportunities for increased profitability. The real-time, customizable visuals provided by Grow have given Altaworx deep insights into their product's performance, enabling them to shift their marketing strategies for better returns. Forrest Derr, as the Director of Finance and Automation, has successfully incorporated Grow dashboards, enhancing company-wide clarity and promoting informed decision-making, highlighted by the impressive recovery of $40,000 in cash flow in just two months. This distinction showcases the prowess of business intelligence data visualization.
B. Inventory Management:
For an inventory manager, real-time insights are crucial. Compared to manual tracking in Excel, visualization tools provide dashboards that reflect live data, enhancing efficiency and accuracy. Dolls Kill, a fashion-forward e-commerce brand, leverages Grow for real-time insights, transforming their approach to business with live data visibility. Jon Dussel, CFO, praises the blend of customizable charts and on-the-spot data updates, driving their data-centric success.
C. Budgeting and Financial Analysis:
Many finance departments rely on Excel's advanced formula capabilities for budgeting and forecasting, taking advantage of its flexibility and wide adoption.
Making the Right Choice for Your Business
A. Factors to Consider
-
What's your data volume?
-
Do you need insights in real time?
-
How often does your team collaborate on data?
-
Are budget constraints a concern?
B. Transitioning from Excel to Visualization Tools
If you decide to make the leap, ensure a smooth migration by setting clear data migration pathways and offering your team adequate training. This transition can usher you into a new step into business intelligence data visualization.
Conclusion
Both Excel and modern tools have their rightful place. While Excel is excellent for specific tasks, the industry of no-code data visualization tools brings unparalleled benefits, especially in an era where data drives decisions. Many businesses utilize both, tapping into the strengths of each tool based on specific needs. In a data-driven age, the key is leveraging the right tool for the right task.
If you're contemplating the right tool for your business data visualization needs, remember that the future leans heavily towards dynamic, interactive insights. Are you wondering if it's time to make the shift? Check out this insightful blog on ‘Get Out of Excel: 5 Signs You Need a Dashboard’.
Reach out, and let's explore these powerful visualization platforms together. Make your choice based on real user feedback. Click here to see Grow.com Reviews & Ratings 2023 on TrustRadius.
Article source: https://article-realm.com/article/Business/52993-Excel-Spreadsheets-Vs-Data-Visualization-Tools-A-Comparative-Analysis.html
Comments
Reviews

Most Recent Articles
- Oct 6, 2026 RBD Palm Olein Prices Rise as Q2 2026 Supply and Demand Shift by Rahul Gautam
- Oct 6, 2026 The Role of Heat Recovery Technology in Modern Cremation Equipment by Dipak Straits
- Oct 6, 2026 How Advanced Separation Technologies Are Transforming Scrap Processing by Dipak Straits
- Oct 6, 2026 ISO Certification: A Complete Guide for Businesses by Corpbiz Experts
- Oct 6, 2026 Patent Registration in India: A Complete Step-by-Step Guide by Corpbiz Experts
Most Viewed Articles
- 10661 hits Market Overview: Membrane Contactor Industry 2025 by Terra Logistics
- 8580 hits Mist Sprayer Pumps Market Demands, Trends, Industry Analysis, Segmentation by 2032 by ellamrfr
- 6778 hits Next-Gen Connectivity and the Rising Demand for RF Semiconductors by James Cameroon
- 5688 hits Digital Printing Packaging Market by Technology, Application, and Region by James Cameroon
- 4721 hits Flexographic Printing Plates Market Size, Share, Report 2024-32 by ellyse perry
Popular Articles
In today’s competitive world, one must be knowledgeable about the latest online business that works effectively through seo services....
81513 Views

Walmart is being sued by a customer alleging racial discrimination. The customer who has filed a lawsuit against the retailer claims that it...
62501 Views
Are you caught in between seo companies introduced by a friend, researched by you, or advertised by a particular site? If that is...
37321 Views

Facebook, the best and most used social app in the world, has all the social features you need. However, one feature is missing. You cannot chat...
23594 Views
If you have an idea for a new product, you can start by performing a patent search. This will help you decide whether your idea could become the...
14853 Views

Moving becomes easy when you have the right moving accessories. These moving accessories help secure and protect your item by ensuring that no harm...
13234 Views

A lot of us look forward to the result of moving and not the process itself. It is pretty typical behavior, though. As modern people, many things...
13163 Views

Building a custom home is an exciting adventure. It’s your chance to bring your vision to life and create an area that sincerely displays...
12922 Views

Moving from one state, city, or even to a whole different county, is something that is either dictated by choice or circumstance. This is because,...
11979 Views

A membrane contactor is a device that enables the transfer of components between two immiscible phases, typically a gas and a liquid, through a...
10661 Views
Statistics
| Members | |
|---|---|
| Members: | 17159 |
| Publishing | |
|---|---|
| Articles: | 79,625 |
| Categories: | 202 |
| Online | |
|---|---|
| Active Users: | 724 |
| Members: | 0 |
| Guests: | 724 |
| Bots: | 3663 |
| Visits last 24h (live): | 12848 |
| Visits last 24h (bots): | 90416 |

