Featured Articles

In today’s competitive world, one must be knowledgeable about the latest online bus...
Oct 12, 2018
In today's data-rich era, the No-Code Analytics Platform simplifies data analysis without coding skills. Unlike traditional, complex, and costly analytics requiring specialized expertise, these platforms emphasize accessibility, speed, and affordability. Easy data connection, template utilization, and dashboard customization empower individuals to quickly create and share analytics reports, even without extensive technical proficiency.
For example, before using the Grow No-Code Analytics Platform, The Younique Foundation had trouble with complicated spreadsheets, making it hard to understand retreat metrics quickly. They needed help tracking participant progress, figuring out the impact of revenue sources like merchandise sales, and managing various funding for non-profit status. With Grow, they now have easy-to-use tools, helping them manage data better and improve their services.
This blog will guide you in initiating your journey with no-code analytics platforms.
Mastering No-Code Analytics: A Step-by-Step Guide for Beginners
-
Getting Started with No-Code Analytics Platforms
A. Setting up your first no-code analytics project
-
Foundations of No-Code Analytics Project Setup:
Setting up your no-code analytics project involves several essential steps. Before selecting your tool, it's crucial to clearly define your goals, whether it's understanding customer behavior or forecasting sales trends. Once you decide your goal, choose a No-Code Analytics Platform that aligns with your needs and budget; options like Grow, Google Data Studio, or Microsoft Power BI offer various features catering to different requirements.
-
Strategic Project Planning and Platform Selection:
Define your project goals, specifying data types, scale, complexity, and user expertise. Conduct a thorough comparison of No-Code Data Analytics platform features, considering aspects such as visualization, data integration, and collaboration capabilities.
Evaluate different cost models, including subscription-based, pay-as-you-go, or freemium, and align these considerations with your specific needs and budget to find the ideal platform for your project.
-
Efficient Project Onboarding and Template Utilization:
Once you've chosen a platform, create a project space by signing up, naming it, and selecting a theme. Use pre-designed templates for quick project launch, addressing analytics needs like customer segment analysis and retention tracking. In summary, follow these steps for a successful, tailored, no-code analytics project.
B. Data Sourcing and integration basics
Data is the raw material that you need to perform data analysis and visualization. To source and integrate your data, you need to:
-
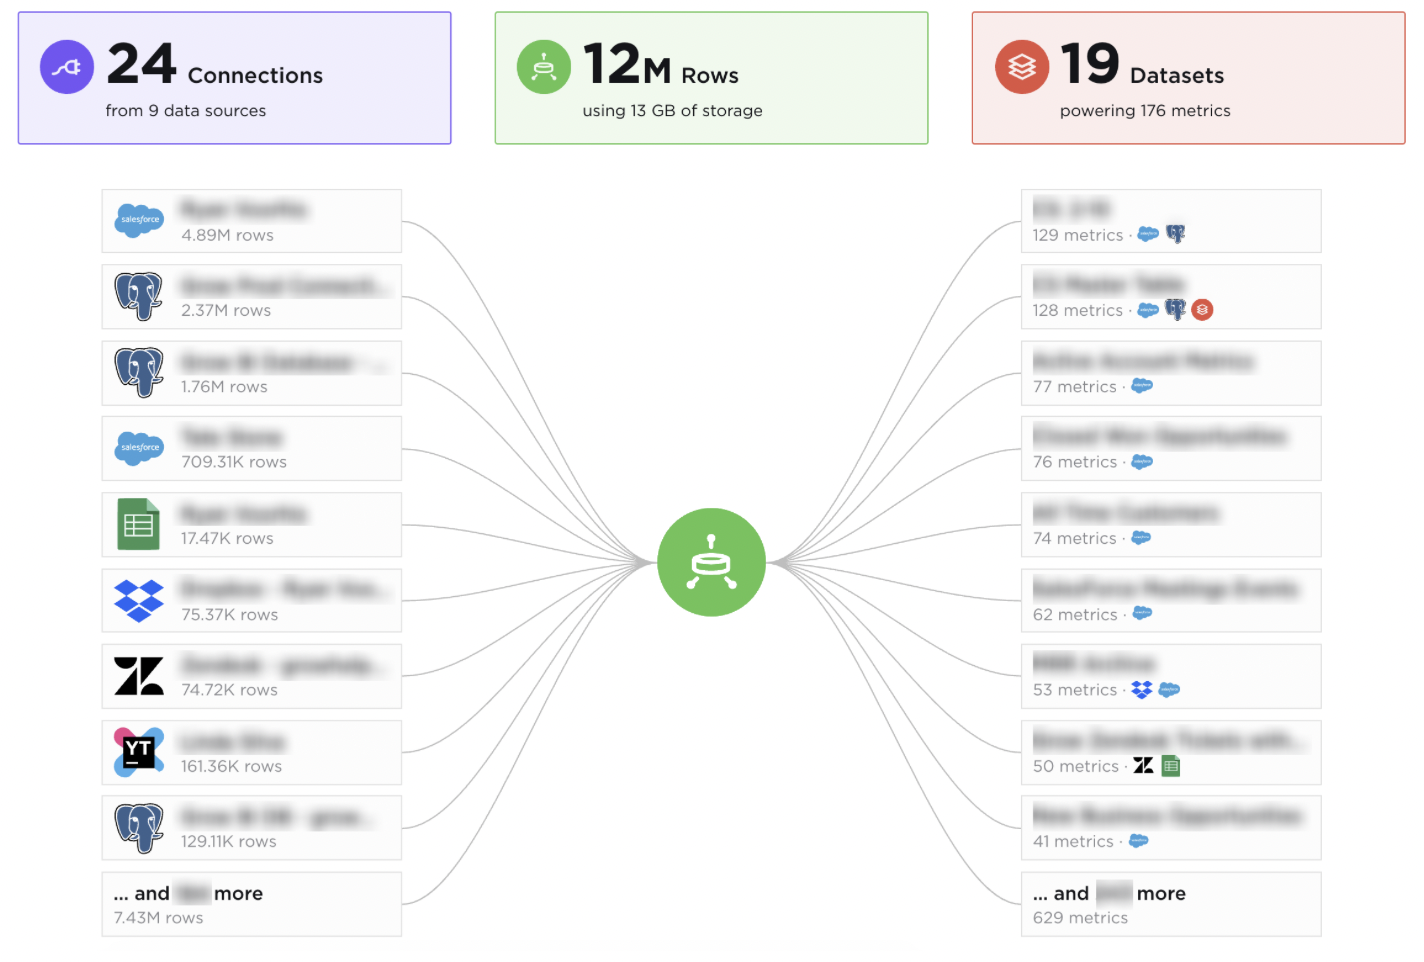
Understanding data sources: Identify where your data resides—internal or external, structured or unstructured. Sources include databases, spreadsheets, web pages, social media, APIs, or files. Ensure accessibility, reliability, and up-to-date information.
-
Connecting data sources: Establish a link between data sources and the No-Code Analytics Platform using connectors, whether built-in or third-party. Options for custom connectors are available.
-
Data importing and formatting: Transfer data from sources to the platform for storage and processing. Ensure uniformity and standardization through importers, catering to different data types and sizes. Custom importers can be created if necessary.
-
Data cleansing: Correct errors and enhance data quality using data quality tools. Address issues like missing values, duplicates, and outliers.
-
Data validation: Confirm correctness, completeness, and relevance for analytics through data audit tools. Inspect, compare, and test to ensure accuracy and reliability.
C. Navigating the user interface and toolset of a typical no-code platform
Mastering No-Code Data Analytics platforms requires a grasp of the user interface and toolset:
-
Dashboard familiarization:
Understand the layout, navigation, and features. Dashboards visually display analytics reports with widgets. Familiarize yourself with the menu, toolbar, sidebar, and footer for efficient access.
-
Tool exploration:
A no-code analytics platform includes specific functions or features designed for tasks like data transformation, analysis, visualization, or output. These platforms offer a variety of tools, such as data visualization options, analytics widgets, and custom coding features. Businesses can explore and utilize these features effectively to achieve their objectives while working with data.
-
Building a simple report:
Once acquainted, initiate report building:
-
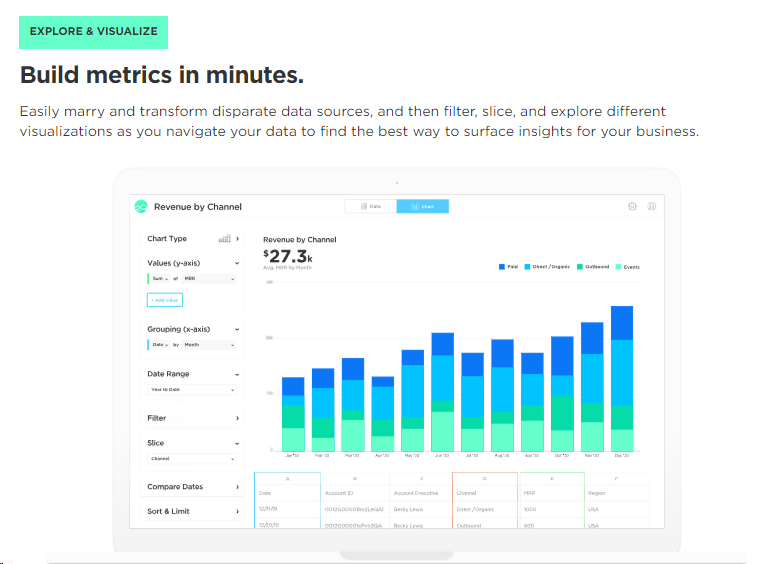
Choose a data source and visualization tool.
-
Configure data settings (metrics, dimensions, filters, aggregations).
-
Adjust visual settings (chart type, color, size, labels).
-
Add and arrange widgets on the dashboard.
-
Repeat for each widget in your report.
-
Interactive Features:
Enhance user experience with interactive features:
-
Drill-down: Explore detailed data by clicking on specific elements.
-
Filter: Narrow down data by applying criteria like date ranges.
-
Sort: Order data based on attributes like ascending or descending.
-
Zoom: Magnify data in specific areas of widgets.
-
Viewing and sharing results:
After building your report:
-
Use view tools for modes like full-screen, presentation, or print.
-
Employ shared tools to export, publish, or embed your dashboard and widgets in formats like PDF, HTML, or URL for seamless sharing.

For example, Grow, a No-Code Data Visualization platform, allows users to connect, store, and blend data from various sources. It offers diverse chart types, supports custom visuals with HTML, CSS, and JavaScript, and promotes collaboration. Designed for business users, it is intuitive, requiring minimal technical skills. Grow is positioned as an affordable and scalable BI tool, not charging per seat or data source.
Validate claims by reviewing real-time feedback from verified users on Grow Reviews from Verified Users Capterra.
-
Advanced Features and Tips
A. Advanced Analytics Features:
No-Code Analytics Platform offers advanced features beyond basic analytics, including:
-
Pre-built analytics functions for everyday tasks.
-
Custom calculations allow personalized metrics or indicators.
-
Tools to understand data insights and trends using trend lines, regression lines, correlation coefficients, and anomaly detection.
B. Automating Data Workflows:
No-code platforms enable automation to save time and ensure data accuracy:
-
Schedule data refreshes at set intervals using schedule tools.
-
Set up alerts and notifications for significant data events using alert tools.
-
Create data pipelines to automate the entire data lifecycle through pipeline tools.
C. Performance and Efficiency Tips:
Optimize your analytics performance and efficiency with these tips:
-
Follow best practices for data visualization, using design tools for effective visualizations.
-
Utilize storytelling techniques to craft compelling data narratives with the No-Code Data Visualization tool designed for effective storytelling.
-
Implement data collaboration methods with collaboration tools for effective teamwork and stakeholder engagement.
Best Practices for Using No-Code Analytics Platforms
To maximize the use of a No-Code Analytics Platform, adhere to essential best practices:
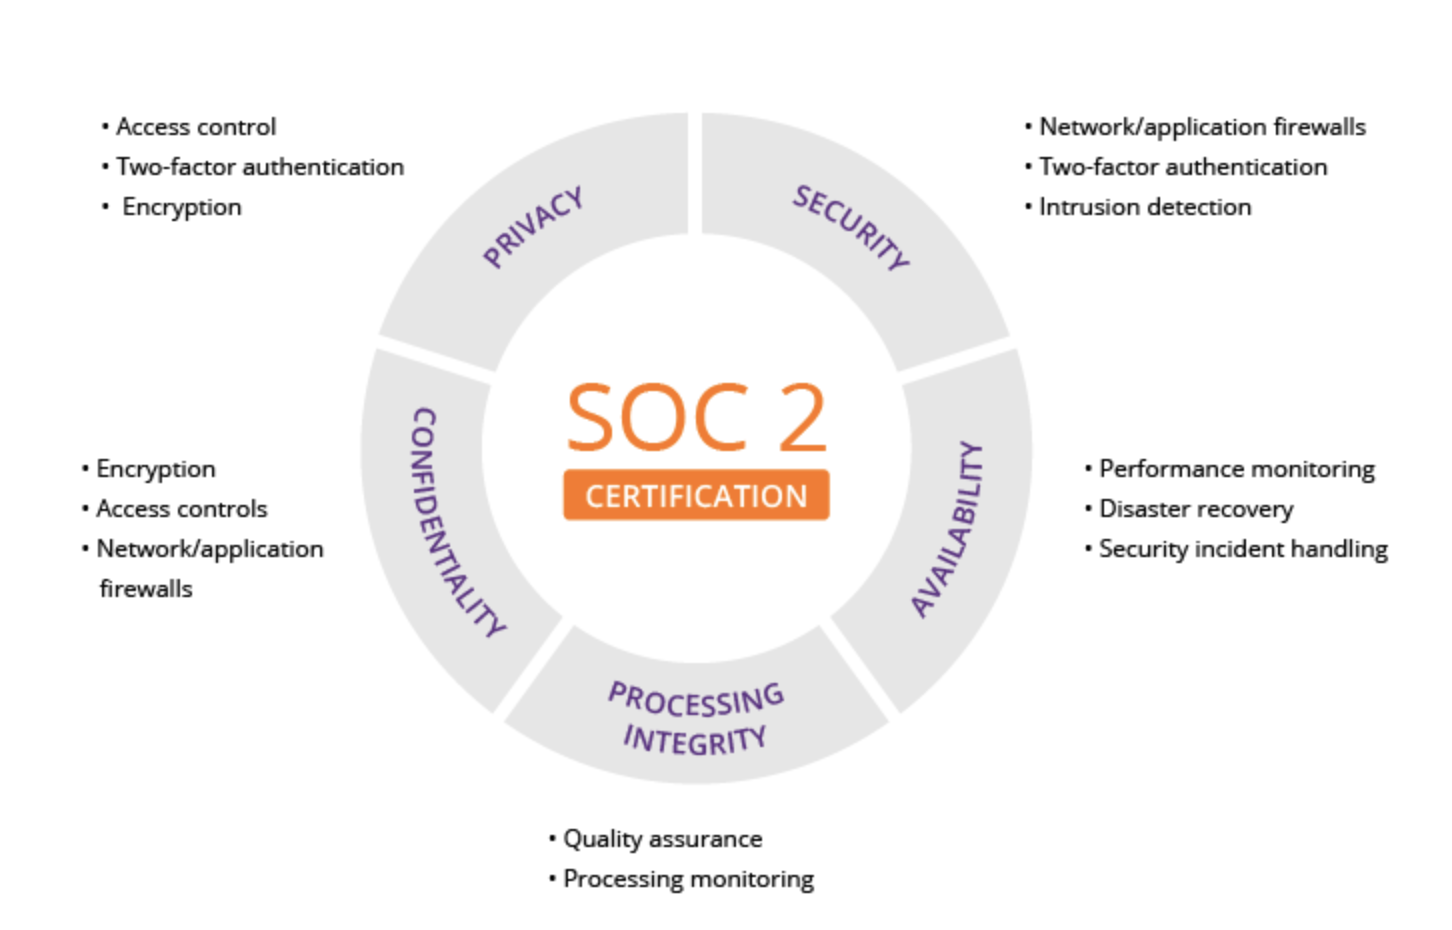
A. Data Security and Privacy: Safeguard data from unauthorized access, disclosure, or modification using security tools such as encryption, authentication, and authorization.
B. Data Governance and Compliance: Ensure adherence to organizational, industry, and jurisdictional standards and regulations, such as GDPR or HIPAA, by utilizing governance tools for managing, monitoring, and controlling data and analytics.
For example, with Grow, businesses can enhance data security through SOC II-compliant processes and certification. The unique Data Pods Architecture isolates your data from others, ensuring privacy, and the platform offers secure connections to various data sources.
Conclusion
No-Code Data Analytics platforms empower users to create insightful reports without coding, saving time and money. Evolving with emerging trends, upcoming features include AI, IoT integration, cloud technology support, and machine learning capabilities.
For advanced no-code analytics, consider Grow—an industry-leading No-Code Business Intelligence platform. With 150+ data sources, 300+ templates, and 50+ chart types, Grow enables easy, fast, and affordable dashboard creation. Collaboration features, goal setting, and alerts enhance team productivity. So why wait? Start a free trial today to experience streamlined analytics and business growth.
Article source: https://article-realm.com/article/Business/55681-A-Beginners-Guide-to-Mastering-No-Code-Analytics-Platforms.html
Comments
Reviews

Most Recent Articles
- Oct 24, 2026 StaticStop to Exhibit at SMTA Space Coast Expo and Tech Forum by Dinesh Kumar
- Oct 24, 2026 Study Business Analytics in Vietnam: Scope, Top Universities, Fees & Career Prospects by Mahesh Mysto
- Oct 23, 2026 AI-Powered Healthcare Imaging in 2026: How Computer Vision Is Transforming Medical Diagnostics by HyprForge
- Oct 23, 2026 What Factors Affect the Service Life of 304 Stainless Steel Pipes? by Jane Tian
- Oct 23, 2026 Acceptance criteria for 304 stainless steel pipe by Jane Tian
Most Viewed Articles
- 10686 hits Market Overview: Membrane Contactor Industry 2025 by Terra Logistics
- 8597 hits Mist Sprayer Pumps Market Demands, Trends, Industry Analysis, Segmentation by 2032 by ellamrfr
- 6801 hits Next-Gen Connectivity and the Rising Demand for RF Semiconductors by James Cameroon
- 5707 hits Digital Printing Packaging Market by Technology, Application, and Region by James Cameroon
- 4741 hits Flexographic Printing Plates Market Size, Share, Report 2024-32 by ellyse perry
Popular Articles
In today’s competitive world, one must be knowledgeable about the latest online business that works effectively through seo services....
81609 Views

Walmart is being sued by a customer alleging racial discrimination. The customer who has filed a lawsuit against the retailer claims that it...
64074 Views
Are you caught in between seo companies introduced by a friend, researched by you, or advertised by a particular site? If that is...
37366 Views

Facebook, the best and most used social app in the world, has all the social features you need. However, one feature is missing. You cannot chat...
23647 Views
If you have an idea for a new product, you can start by performing a patent search. This will help you decide whether your idea could become the...
14903 Views

Moving becomes easy when you have the right moving accessories. These moving accessories help secure and protect your item by ensuring that no harm...
13273 Views

A lot of us look forward to the result of moving and not the process itself. It is pretty typical behavior, though. As modern people, many things...
13230 Views

Building a custom home is an exciting adventure. It’s your chance to bring your vision to life and create an area that sincerely displays...
12968 Views

Moving from one state, city, or even to a whole different county, is something that is either dictated by choice or circumstance. This is because,...
12091 Views

The report is titled as ‘Recombinant Cell Culture Supplements Market: Opportunity Analysis and Future Assessment 2022-2030’. An...
11873 Views
Statistics
| Members | |
|---|---|
| Members: | 17226 |
| Publishing | |
|---|---|
| Articles: | 79,838 |
| Categories: | 202 |
| Online | |
|---|---|
| Active Users: | 72 |
| Members: | 1 |
| Guests: | 71 |
| Bots: | 580 |
| Visits last 24h (live): | 4936 |
| Visits last 24h (bots): | 55724 |